Ecowither: logging Ecowitt weather data to InfluxDB
Last summer my old WS2300 weather station finally gave up, after 15 years of service. So I bought a new one, the Waldbeck Halley Professional Weather Station (also known as WH2650A-WIFI6C6F). This device can log some data (basic outdoor measurements) to online weather services (Wunderground, WeatherCloud, WOW, etc). However, I wanted my data stored locally, also to allow me to browse and publish the data my own way. The vendor does not publish software for this purpose, so I had to code it myself.
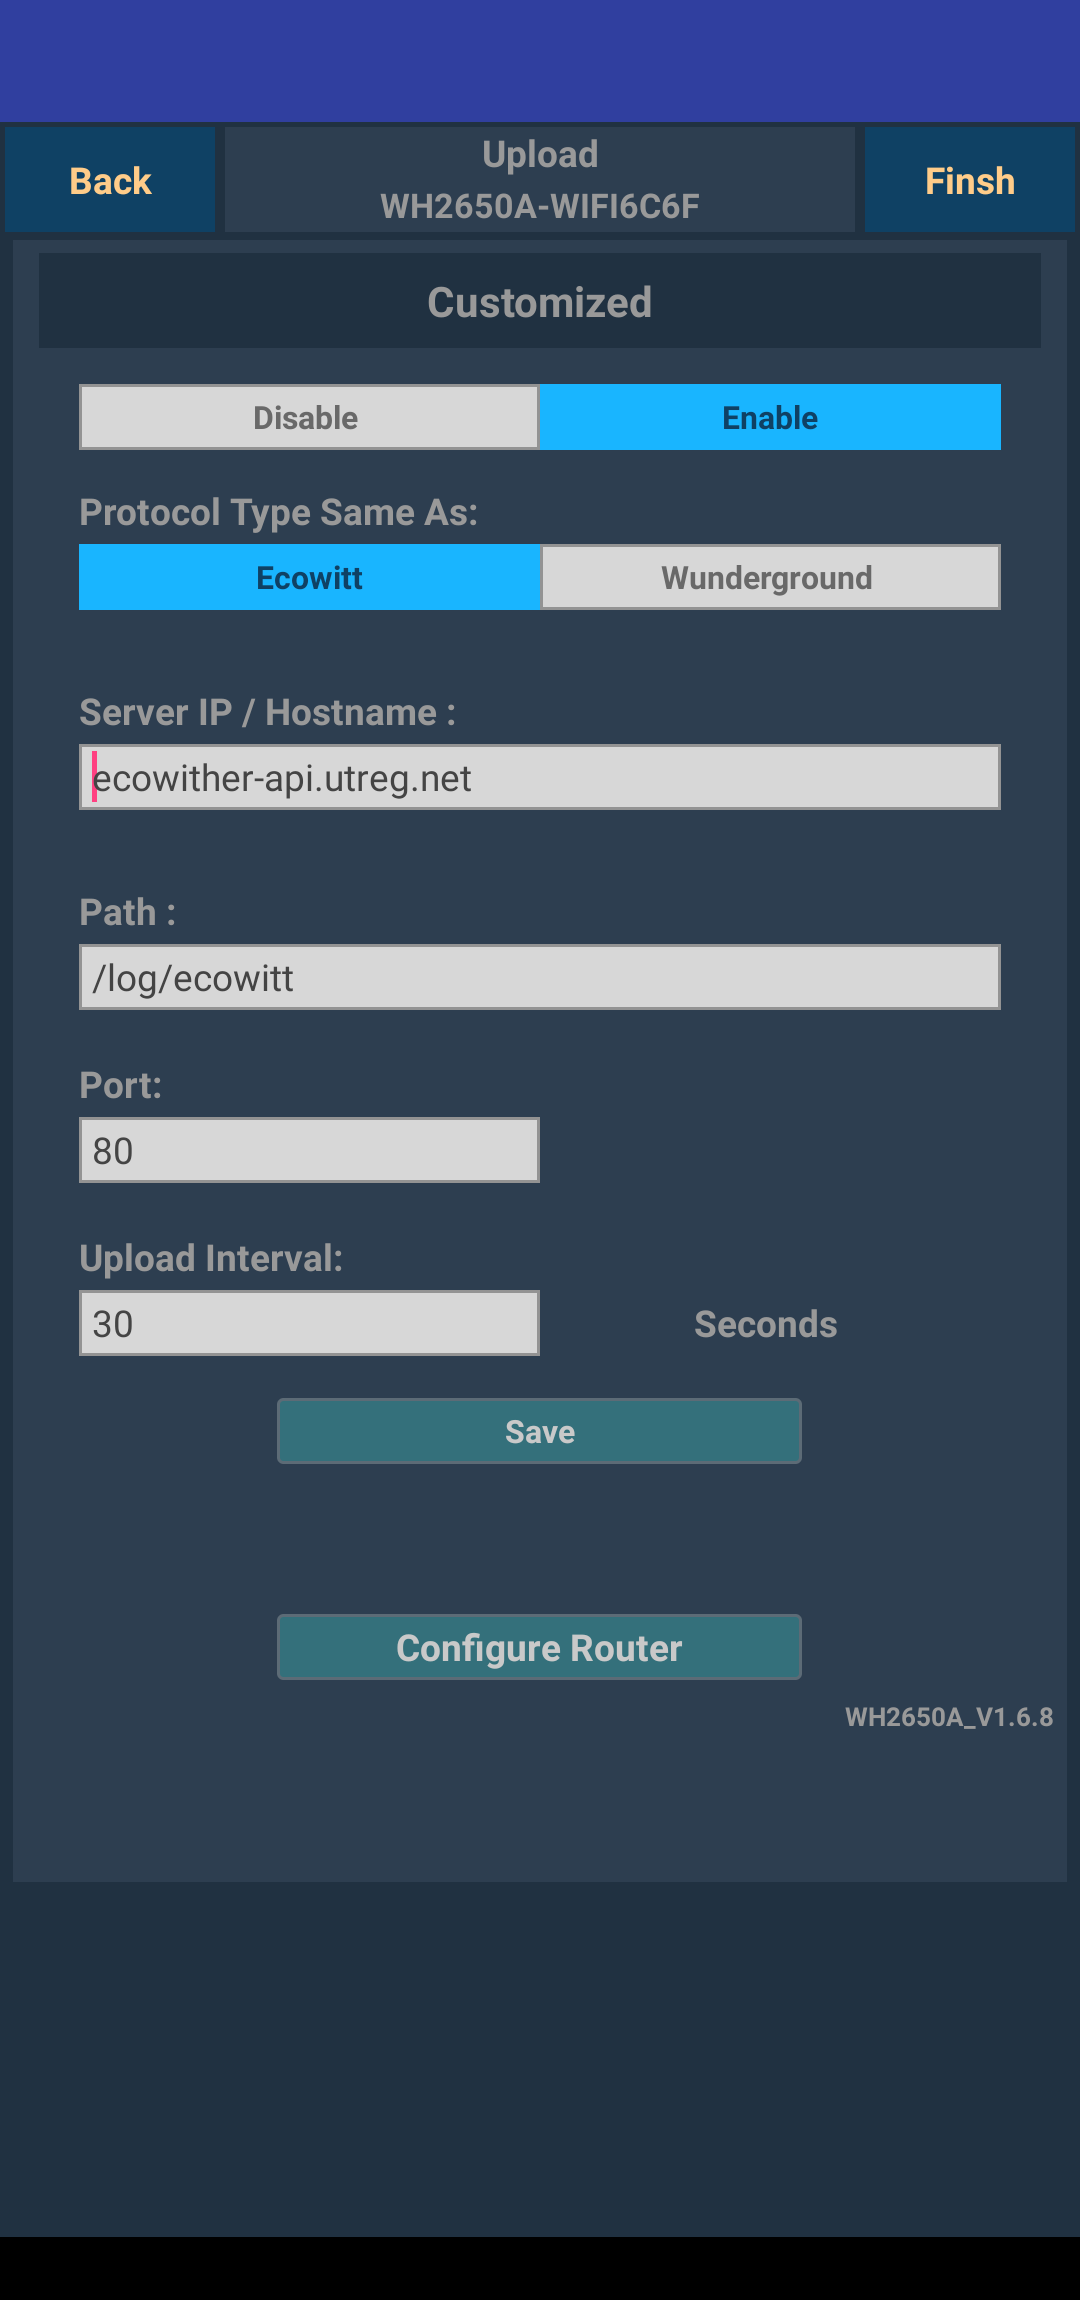
The new weather station has an option to post data to a webserver (API). It supports two formats: Wunderground and Ecowitt. I studied both formats and found out that the Wunderground format only reports basic weather data and does not include data of additional sensors. The Ecowitt protocol however reports really all measurements registered by the station, so Ecowitt is the way to go.
The Ecowitt protocol posts data to a weather service using a HTTP POST command. I built a very simple webserver to capture the POST statement, this is how it looks like:
POST / HTTP/1.1
HOST: localhost
Connection: Close
Content-Type: application/x-www-form-urlencoded
Content-Length:537
PASSKEY=307826236D0133E06009CE7FAFBBAFC4&stationtype=WH2650A_V1.6.8&dateutc=2021-12-24+11:31:57&tempinf=66.0&humidityin=51&baromrelin=29.565&baromabsin=29.565&tempf=47.8&humidity=91&winddir=261&windspeedmph=8.95&windgustmph=14.76&maxdailygust=21.70&solarradiation=57.25&uv=0&rainratein=0.000&eventrainin=0.071&hourlyrainin=0.000&dailyrainin=0.012&weeklyrainin=0.110&monthlyrainin=1.421&yearlyrainin=24.256&totalrainin=24.256&temp1f=49.46&humidity1=98&temp2f=63.50&humidity2=51&wh65batt=0&wh25batt=0&batt1=0&batt2=0&freq=868M&model=WH2650
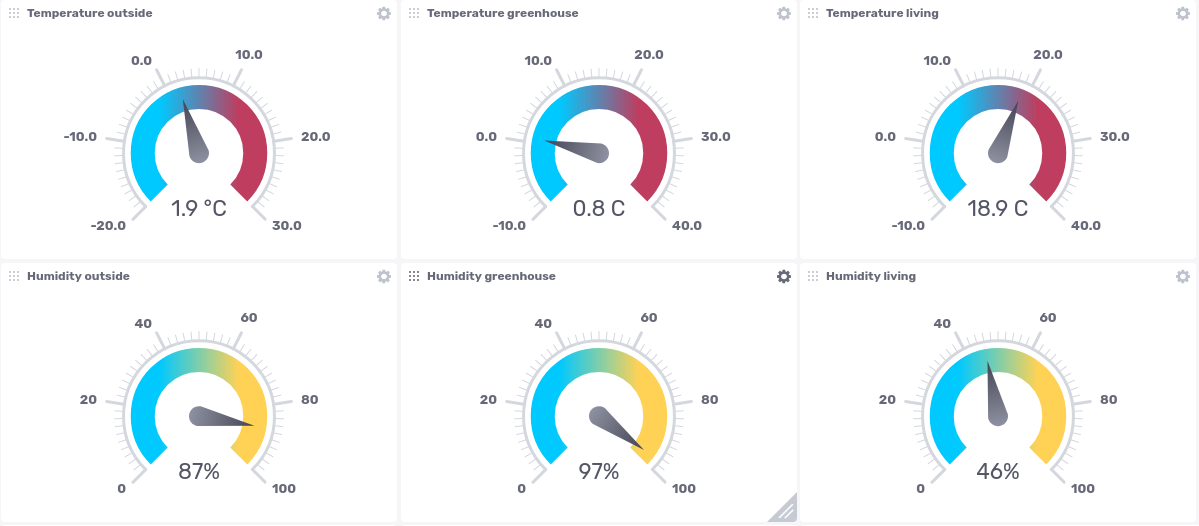
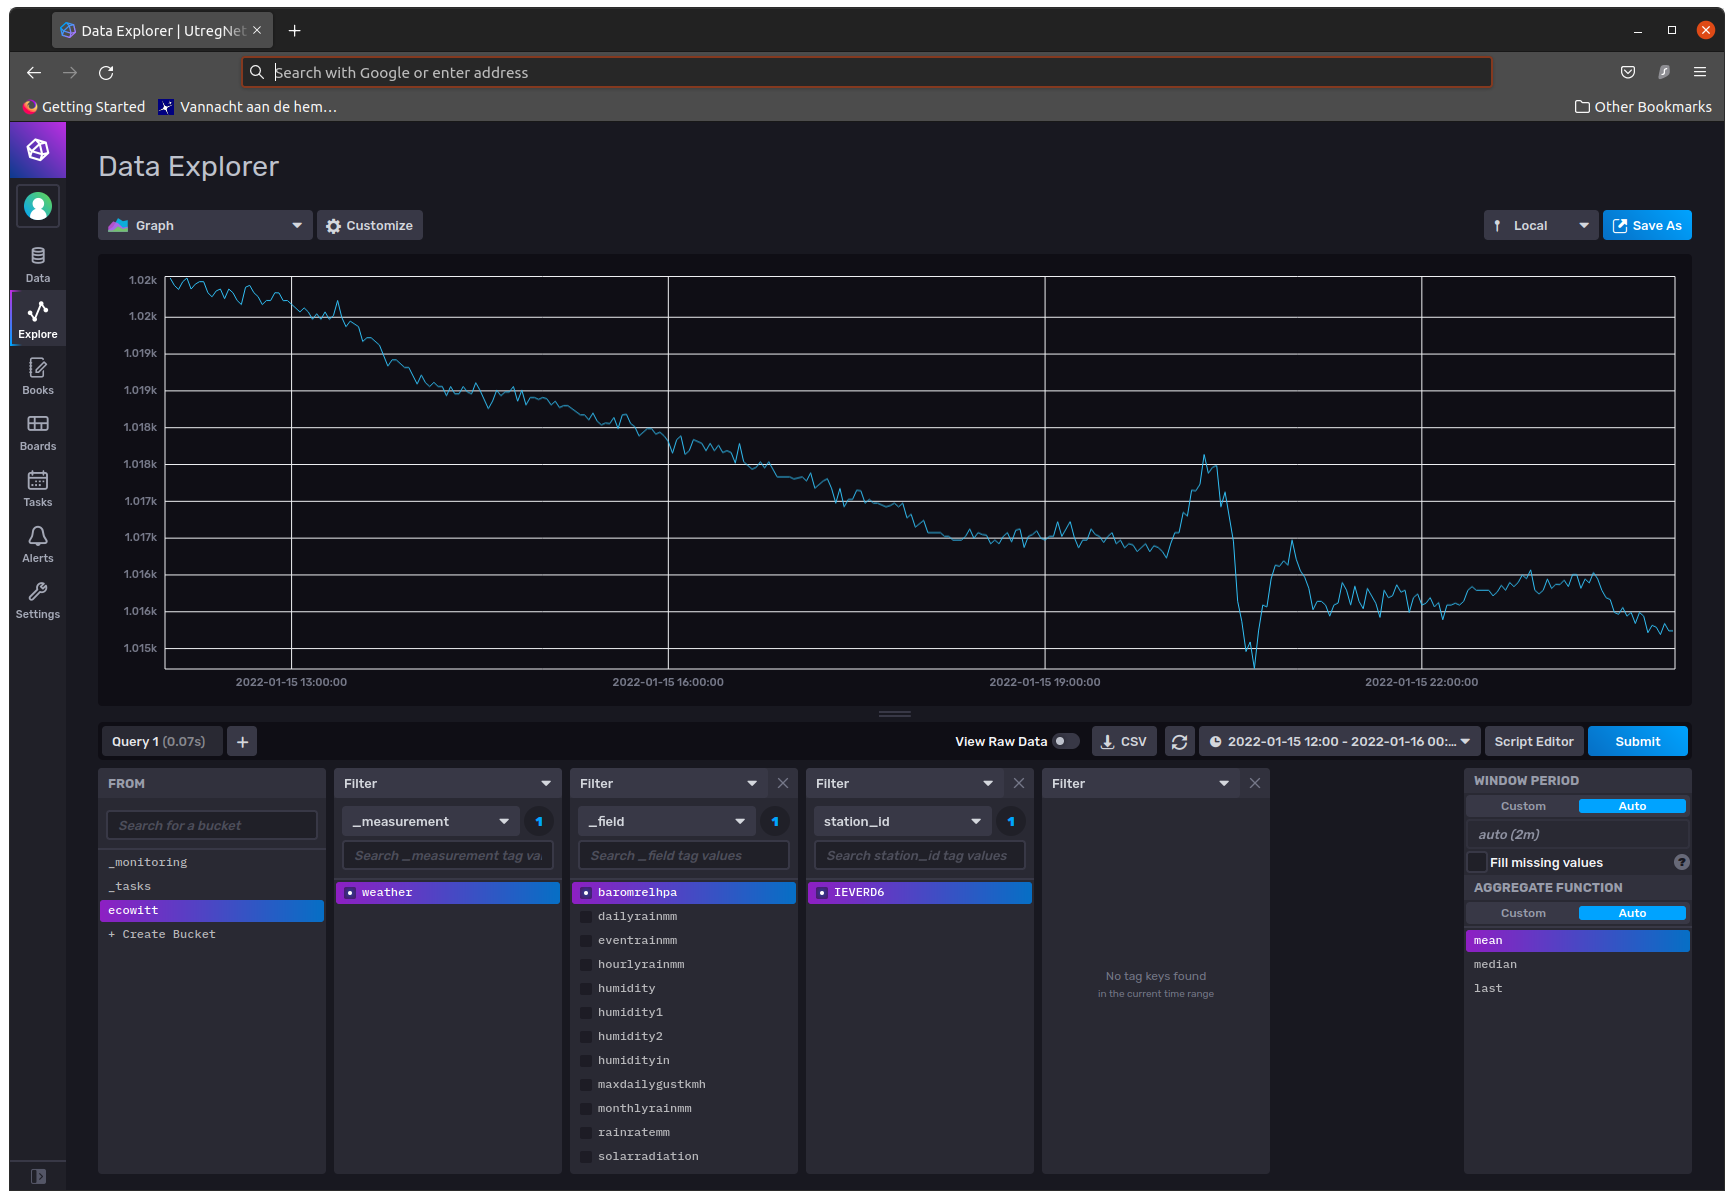
Although I’m most familiar with MySQL/MariaDB databases, I decided to use InfluxDB. This is a “time series database” and should easier handle the measurements than a SQL database. Also, InfluxDB v2 has some builtin reporting functions, including a nice dashboard. Also, it is very easy to link Grafana to InfluxDB and create even fancier dashboards!
There was still one piece missing: the API/webserver to catch the HTTP POST’s from the weather station and store the data into InfluxDB. This was the right moment to start experimenting with Flask. This is a web framework for Python and allows you to build an API in just a few lines of code. You basically define URL’s and attach code to each URL. In my case, some metrics had to be converted too: rain in mm instead of inches, temperatures in Celsius instead of Fahrenheit. I named my program ‘Ecowither’, which is a conjunction of ‘Ecowitt’ and ‘Weather’.
I published my code on Github. The repository also includes a kubernetes deployment file, since I run both Ecowither and InfluxDB on my Kubernetes cluster.
Hi Ernest,
I just came across your post about the ECOWITT weather station.
For me, it is also the case that the fun weather station has to be replaced.
I would like to use your software as a template and use a Raspberry Pi 3 as a server.
I’m happy to have such a good guide. I have already done a lot with the Raspi, Docker etc. but I lack the technical background for such a solution.
Thank you very much
Andreas