CLI for dutch water data
Here in the Netherlands we have a public organisation named Rijkswaterstaat. This organization keeps track of all the water in and around our country. Think about sea levels, locks in rivers, etc. To do so they have an extensive network of sensors around the country, monitoring water levels, current speed, temperatures, etc. I wrote a command line interface to access this data.
People living in The Netherlands are always curious about water. Although there is a high level of trust in all the waterworks, they are always just a bit more alert when a storm smashes the sea water against the dams and dunes, or when river tides gets too low to allow transport over water. They know how important these structures are, since a large part of the country is below sea level.
The dutch government has a ministry and a couple of organisations that deal with all this. One of the most important organisations is Rijkswaterstaat, which manages (according to Wikipedia) “public works and water management, including the construction and maintenance of waterways and roads, and flood protection and prevention”.
One of the services of Rijkswaterstaat is running a large network of sensors to monitor the water in and around the country. All data of these sensors is publicly available, and Rijkswaterstaat also publishes this on their Waterinfo website, with nice maps and graphs.
Command line interface
The graphical representation is not really accessible for blind people, some of them prefer the “raw” data in text tables so see how water levels change in time. One of my friends is blind AND interested in this data, so I decided to build him a nice CLI (command line interface). This was rather easy to build, since the data is also available by means of a nice API. I named the tool wtr, it’s written in Python and the code is open source (GPL). You can find it on GitHub. The code is tested on Linux, but will probably run on any operating system that can run Python.
I’m actually quite happy with the code, since it is probably my most professionally written Python code so far. I used tools like pylint and black to ensure the code syntaxt and formatting. On GitHub I have configured GitHub Actions which run pylint for miscellaneous Python versions and do some functional tests on the code as well. I used Visual Studio Code to write the code, with some help of GitHub Copilot. This is a gen-AI tool that acts like a second developer sitting next to you, helping you to suggest and improve code. This really speeds up the process.
Caching metadata
The API provides two types of data: the actual measurements and metadata. The metadata includes location names, coordinates, units and descriptions of the measurements. When you run wtr for the first time, it will download this metadata and cache it in a SQlite database. When this database gets lost, it will simply be recreated, since it is only for caching the metadata. No measurements are stored locally.
Getting started
To list observations you need two things: the type of measure and the location.
Run this command to obtain a list of available measures:
$ wtr list -c measures
Compartment_Code (Description): Measure (Description) - Note
BS (Bodem/Sediment): ACTVTCCTTE (Activiteitsconcentratie) - Activiteitsconcentratie americium 241 in Bodem/Sediment t.o.v. drooggewicht in Bq/kg
BS (Bodem/Sediment): D10 (maximale korreldiameter voor 10% van het monstervolume) - Maximale korreldiameter voor 10% van het monstervolume Bodem/Sediment t.o.v. drooggewicht in um
(...)
Run this command to see all locations, including the available measure(s):
$ wtr list -c locations
Location (Name): Compartment_Code (Description) - Measure (Description)
A12 (A12 platform): LT (Lucht) - WINDRTG (Windrichting)
A12 (A12 platform): LT (Lucht) - WINDSTOOT (Maximale 3" windstoot in de afgelopen 10 minuten)
(...)
So let’s say you want information about the flow rate in one of our rivers, dutch stroomsnelheid. First find the corresponding measure, for example:
$ wtr list -c measures | grep -i stroom
OW (Oppervlaktewater): STROOMRTG (Stroomrichting) - Stroomrichting Oppervlaktewater t.o.v. ware Noorden in graad
OW (Oppervlaktewater): STROOMSHD (Stroomsnelheid) - Stroomsnelheid Oppervlaktewater m/s
So the measure we need is named STROOMSHD. Next find locations for this measure:
$ wtr list -c locations | grep STROOMSHD
ALBL (Alblasserdam): OW (Oppervlaktewater) - STROOMSHD (Stroomsnelheid)
ALBSDRTOVR (Alblasserdam rechteroever (nabij brug)): OW (Oppervlaktewater) - STROOMSHD (Stroomsnelheid)
BORNDP (Borndiep): OW (Oppervlaktewater) - STROOMSHD (Stroomsnelheid)
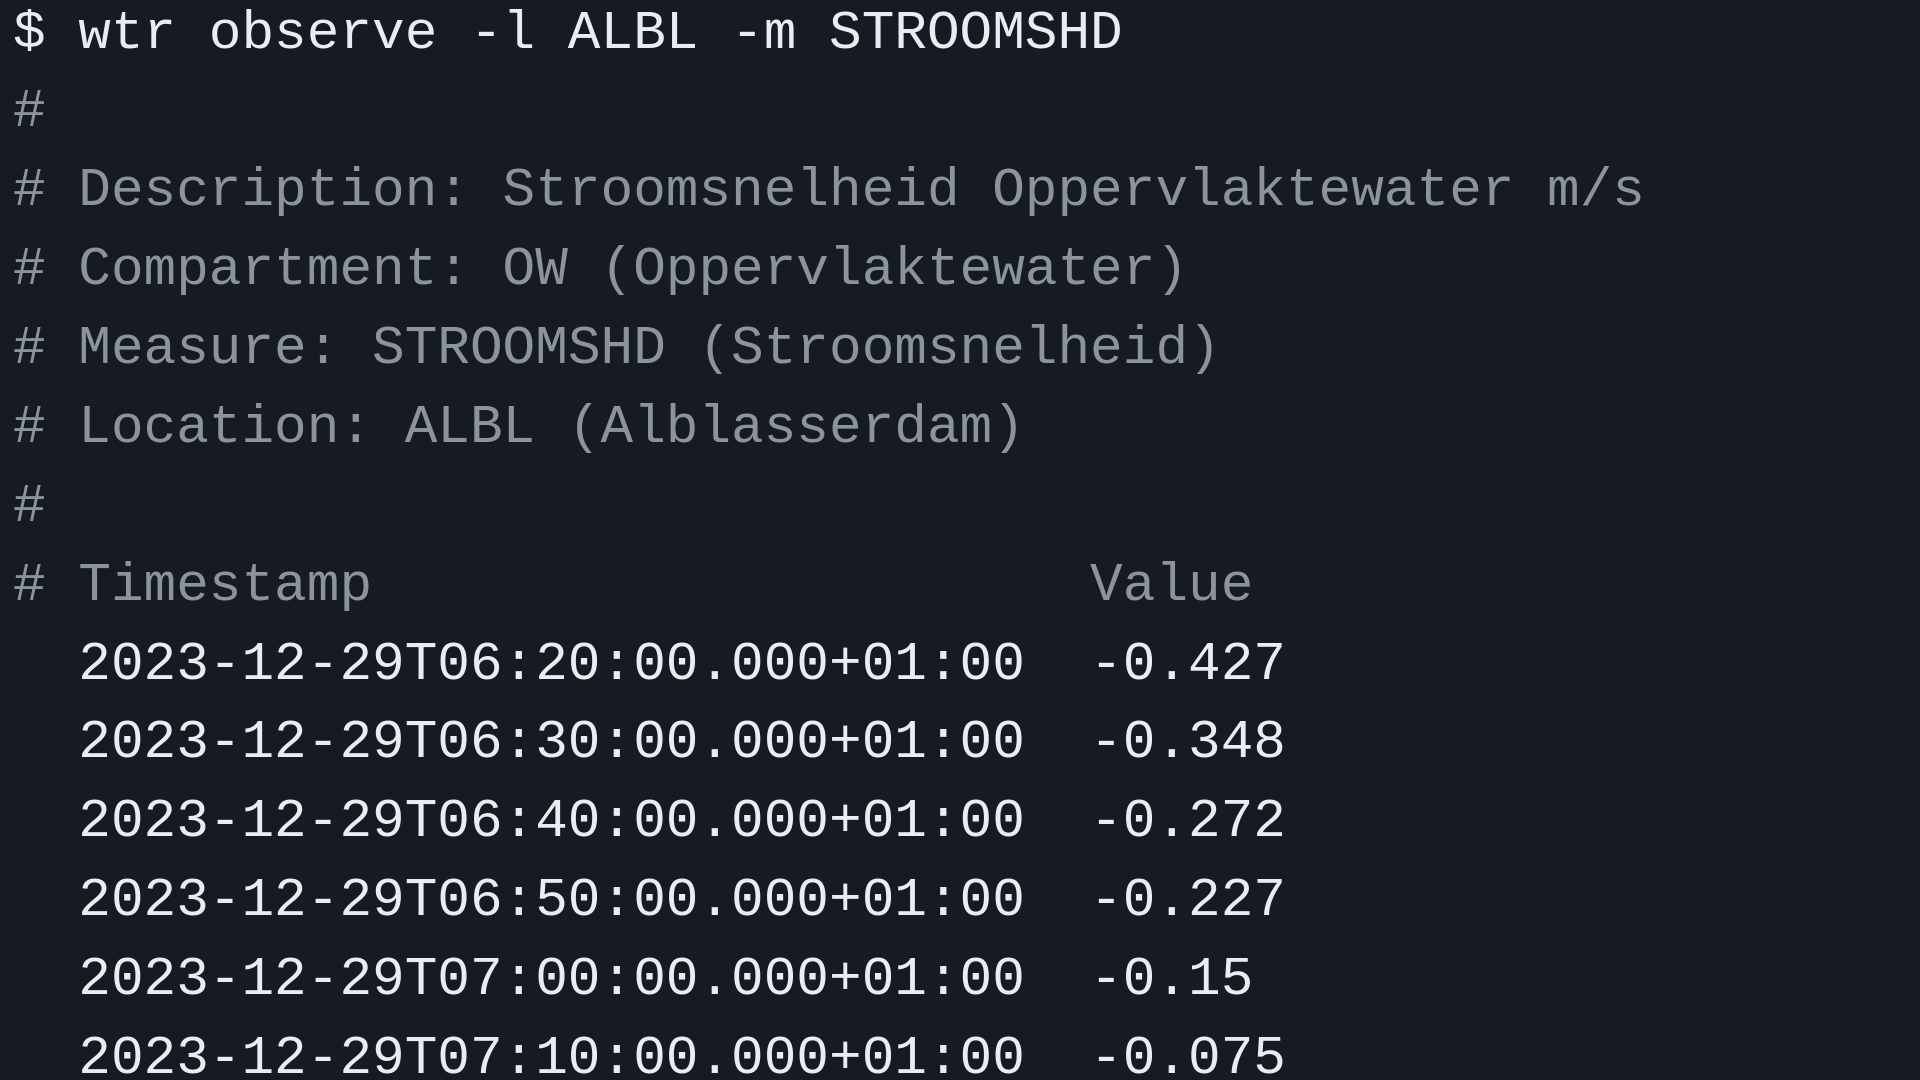
(...)We are interested in the location ALBL, so let’s limit the list
$ wtr observe -l ALBL -m STROOMSHD
#
# Description: Stroomsnelheid Oppervlaktewater m/s
# Compartment: OW (Oppervlaktewater)
# Measure: STROOMSHD (Stroomsnelheid)
# Location: ALBL (Alblasserdam)
#
# Timestamp                      Value
  2023-12-29T06:20:00.000+01:00  -0.427
  2023-12-29T06:30:00.000+01:00  -0.348
  2023-12-29T06:40:00.000+01:00  -0.272
  2023-12-29T06:50:00.000+01:00  -0.227
  2023-12-29T07:00:00.000+01:00  -0.15
  2023-12-29T07:10:00.000+01:00  -0.075
  2023-12-29T07:20:00.000+01:00  0.021
  2023-12-29T07:30:00.000+01:00  0.125
  2023-12-29T07:40:00.000+01:00  0.218
  2023-12-29T07:50:00.000+01:00  0.286
  2023-12-29T08:00:00.000+01:00  0.377
  2023-12-29T08:10:00.000+01:00  0.465
  2023-12-29T08:20:00.000+01:00  0.525
  2023-12-29T08:30:00.000+01:00  0.567
  2023-12-29T08:40:00.000+01:00  0.616
  2023-12-29T08:50:00.000+01:00  0.662
  2023-12-29T09:00:00.000+01:00  0.717
  2023-12-29T09:10:00.000+01:00  0.78
Default the most actual 18 rows are shown, which represents the past 3 hours (most measurements do have a 10 minute interval). If you want to go further back in time, use the --rows (or -r) option, for example:
$ wtr observe -l ALBL -m STROOMSHD -r 144 # 24 hoursNotes:
- Although the list of locations and measures is extensive, not all are currently in use. So for many combinations you will find no actual data. Often you get multiple locations for the same site, only one reporting the requested measure.
- Measure history is limited to 48 hours (288 rows for 10-minute data).
- Most measures are in dutch, even keys/labels in the API data are in dutch, so if you’re not familiar with the dutch language, usage this tool and the retreived data will be limited.
Source code
As mentioned before in this article, the source code is available on GitHub: